Data Visualizations
Note: this is a paid Premium feature. (opens in a new tab) To learn more about our Premium features, please visit our Pricing (opens in a new tab) page.
Grantseeker gives you access to Visualizations to help you plan your grantseeking efforts with visual representations of your work. Visualizations are dependent on the grant's start year, thus, when a visualization doesn't look as expected, it's mostly because a grant is missing its Start Date.
Data Visualizations can be found under "Data" in the top navigation bar. Simply click on "Data", then click on "Visualizations" to go to the visualizations page.

Types of visualizations:
- Budget Summary
- Grant Payments by Month
- Grant Status Summary
- Year over Year Grant Awards
- Grants Amounts by Program
1. Budget Summary
The Budget Summary visualization allows you to get a glance of the total funding you have been awarded, as well as the total funding still in the pipeline for a particular Fiscal Year. This data is calculated by grant start date, and filtered on by fiscal year. In addition, "Funding Goal" is editable and specific to each year. The Request Pipeline will include your Requests in the statuses Draft and Submitted, but not Rejected Requests.
Data will appear as shown below:

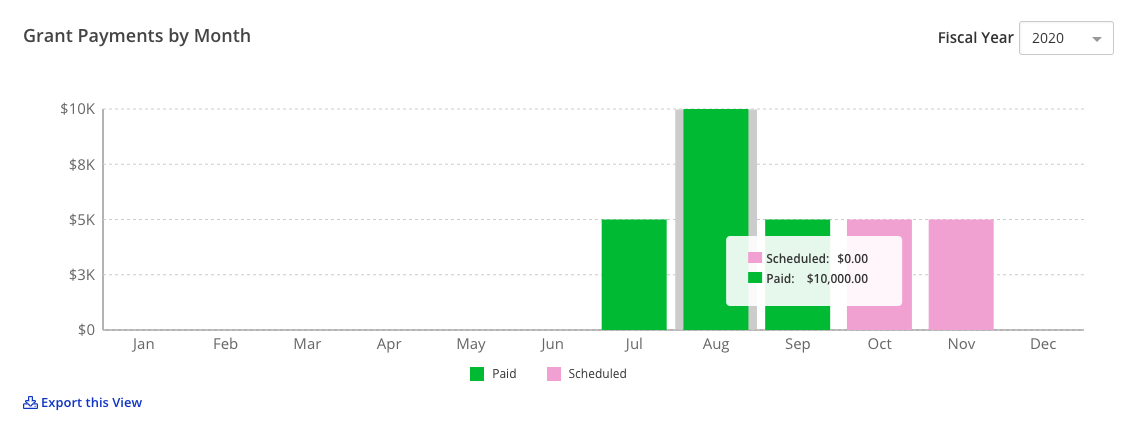
2. Grant Payments by Month
The Grant Payments by Month gives you a month-by-month visualization of all grant payments received (paid), as well as grant payments scheduled to be received for a particular Fiscal Year. This data is calculated by Payments records (which are attached to grants), and which also depends on the payment scheduled date and the Payment Status. As you hover over each bar, it will display how much money was awarded as a grant for that specific month.
Data will appear as shown below:
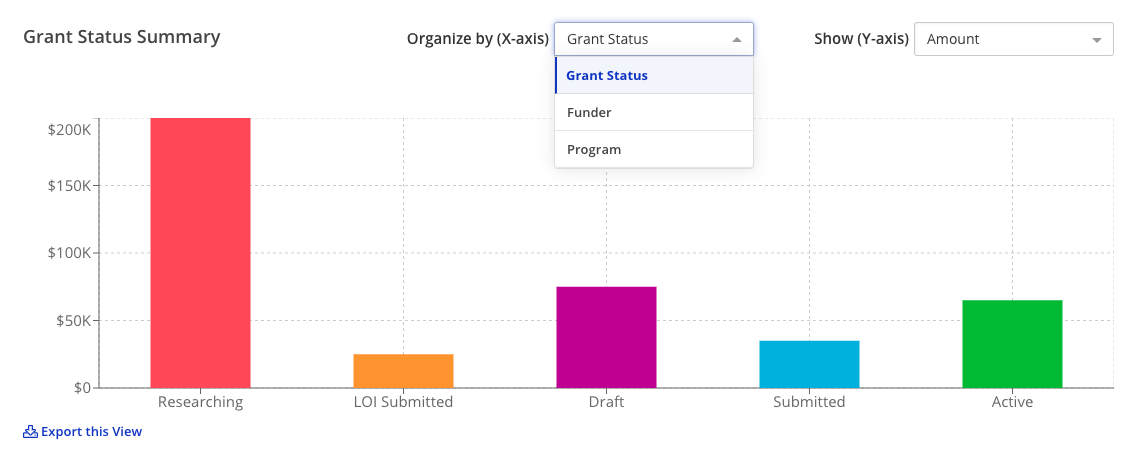
3. Grant Status Summary
The Grant Status Summary visualization allows you to organize (X-axis) the graph by:
- Grant Status
- Funder
- Program
You can also choose to show (Y-axis) the graph by:
- Amount
- Count
Depending on how you organize your graph, different data points will pop up as you hover over each bar. Data in Grant Status Summary is not filtered for a particular Fiscal Year. Data will appear as shown below:
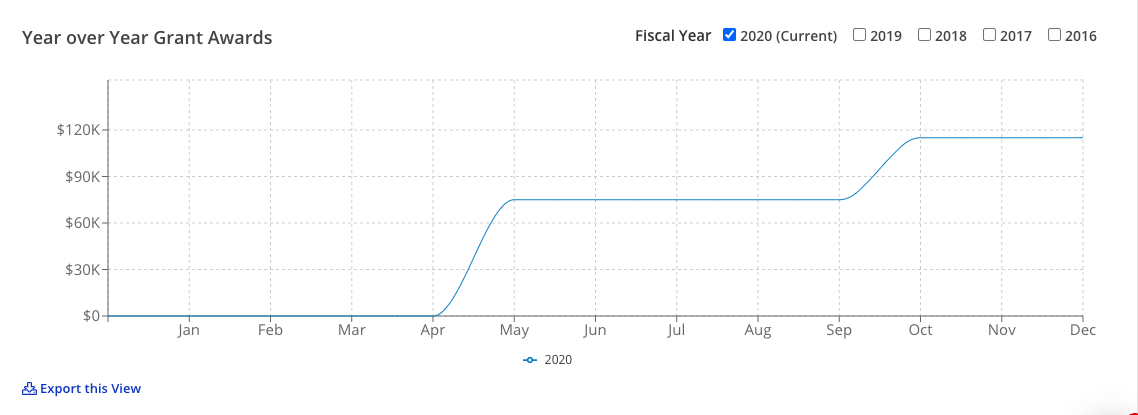
4. Year over Year Grant Awards
The Year over Year Grant Awards visualization allows you to see your grant amounts funded by Fiscal Year, all within the same graph to better allow you to see how you're trending year over year.
This graph also calculates which month and year a grant falls in based on the grant's start date. This graph will include any grants with start dates, regardless of status as 'Active' or 'Closed'.
- X-Axis: Month grant begins at
- Y-Axis: Cumulative amount funded
Data will appear as shown below:
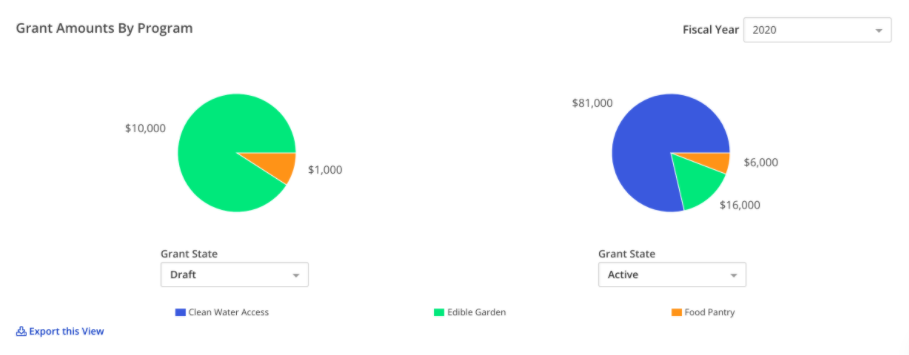
5. Grant Amounts by Program
The Grant Amounts By Program visualization allows you to see at a glance your total funding level, based on Program. The data for this visualization is based on the Program Allocation Amounts, and can be set to show the current fiscal year, as well as the previous 4 fiscal years (if available).
The program year will dictate which Fiscal Year the program allocation appears in (unlike the Budget Summary or Year over Year grant award visualizations). This graph does not consider grant Start Dates.
Data will appear as shown below: